
A local-first desktop app that turns raw brokerage history into a clear dashboard, a UK tax estimate and an ISA allowance tracker, with nothing leaving the computer it runs on.
The itch
Broker apps are good at answering “what is this share doing today?” and much weaker at “how is the whole thing actually doing?” Once you hold a general investing account alongside a Stocks ISA, a few questions get surprisingly hard:
- How much has gone in altogether, and what is it worth after every profit, loss, fee and dividend?
- How much of the gain was the shares, and how much was the pound moving against the dollar?
- How much of this year’s ISA allowance is left, and did a transfer accidentally break the limit?
- What will HMRC want for the tax year, and is there anything legitimate to do about it before 5 April?
A spreadsheet can answer all of these, but it is fragile, it needs feeding by hand, and every rule change means hunting through formulas. So I built a desktop app that pulls the history through the broker’s API, keeps it in a local database and does the sums properly.
Principles set before any code
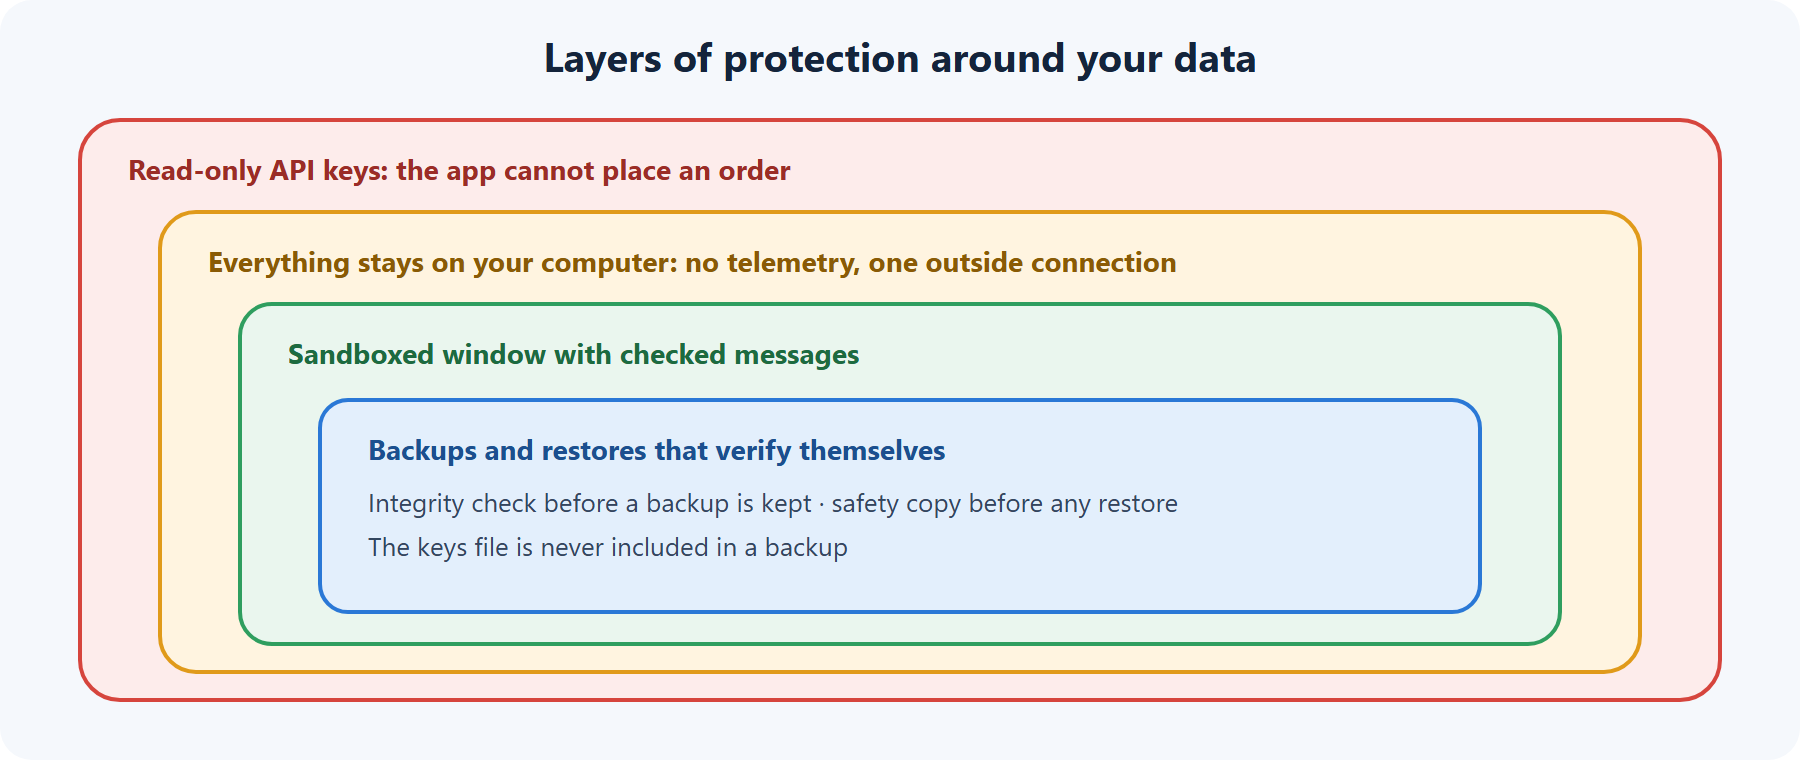
- Local-first. The data is a complete financial record, so it lives in a database on the user’s own machine. The only outside connection is to the broker. There is no analytics, no telemetry and no crash reporting.
- Read-only, by construction. The app never calls an endpoint that can place an order, and the keys it uses carry no trading permission at all. The worst a bug can do is show a wrong number.
- Estimates, not advice. Every tax screen says so, lists its assumptions and flags the items that need human judgement.
- Honesty about freshness. Prices are “as of the last pull”, with the time shown, never dressed up as a live feed.
What it does
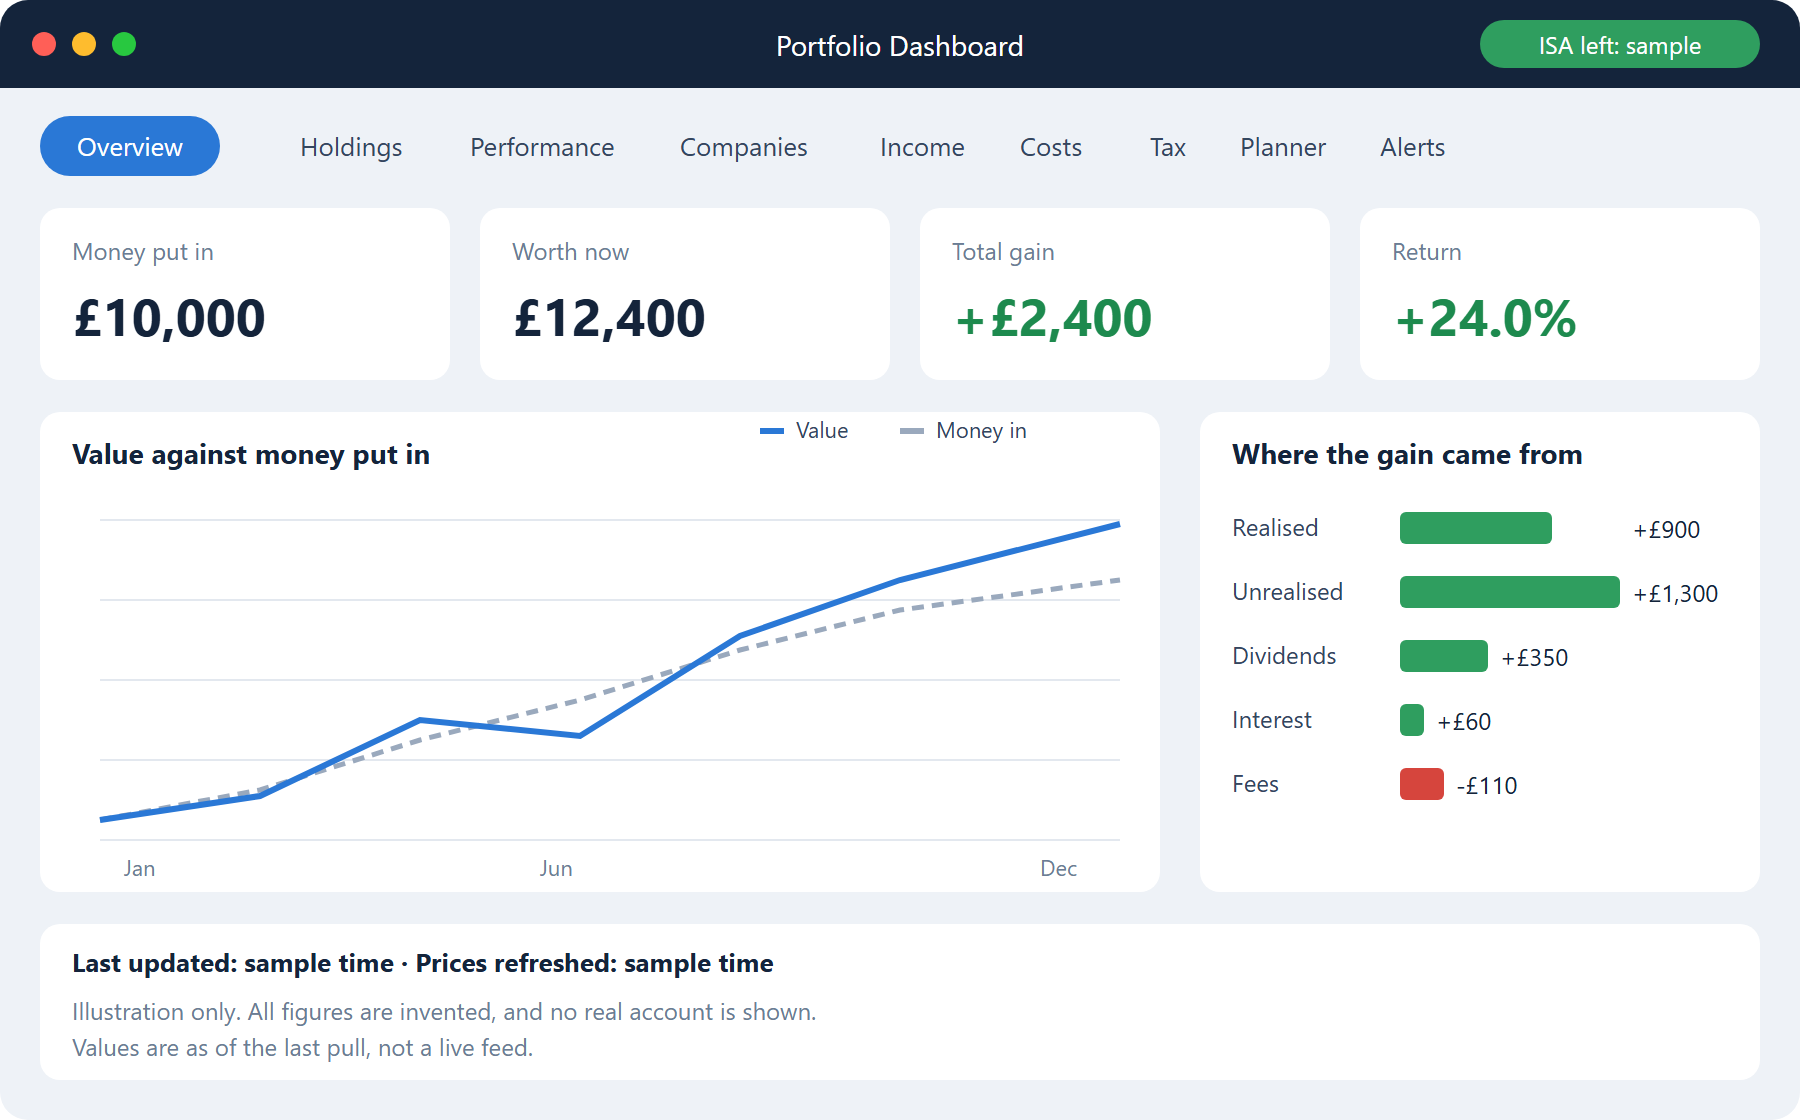
The window is a set of tabs, each answering one question. The headline figure lives on Overview: what went in, what it is worth, and the gain. The other tabs explain it.
Overview, Holdings and Performance
Overview shows total money in, current value and total gain, with a breakdown of where the gain came from: realised profit, unrealised profit, dividends, interest and fees. Holdings lists every position with its price in the share’s own currency, the average price paid, its weight, and a warning if one share grows past 40% of the total. Performance goes month by month and includes an annualised return (XIRR) that accounts for when money went in.
Companies, Income and Costs
One row per company, open or closed, with the amount invested, value, realised and unrealised result, dividends and the effect of currency. Income tracks dividends and interest, including withholding tax on overseas dividends. Costs adds up everything the broker took, so the real price of trading is visible.
Daily value
The broker only reports today’s values, so history cannot be rebuilt afterwards. The app records a reading each time it pulls and never overwrites a previous day, so a daily value chart builds up over time and can be compared with an index. Gaps show up as gaps, not estimates. An optional background task records a reading even while the app is closed.
Alerts
Set a trigger on a share you hold: a price above or below a level, or a percentage above or below your average price. Triggers are checked whenever fresh prices arrive, and an optional step hands the alert to a Shortcut so it can reach a phone or watch. The app is upfront about the limits: it does not receive live prices, and it checks nothing while the computer is off.
Planner
Before buying, the trade planner answers “is this worth it?” Enter a buy price, a sell price and an amount, and it shows the profit after every cost, the capital gains tax on it, the break-even price, and the same trade at other exit prices. For overseas shares it separates out how much of the result came from the exchange rate. It does the arithmetic for the prices typed in. It cannot say where a price will go.
The tax engine
This took the longest, and it is the part I trust most because it is the most heavily tested. It is a set of pure functions: ledger, rules and tax profile go in, figures come out. It covers:
- Capital gains tax using the UK share-matching rules (same day, the 30-day “bed and breakfast” rule, then the pooled average cost).
- Dividend and interest tax, against the allowances for the relevant band.
- ISA allowance tracking per tax year, including money paid into ISAs elsewhere.
- Self Assessment support: a pack of figures to work from when filing.
- A what-if tool showing the effect of a sale on this year’s bill.
Rates and allowances are data, not hard-coded constants. When a Budget changes a threshold, the fix is to edit one rules file and re-read the source pages, not rewrite logic.
Tax options: showing the working
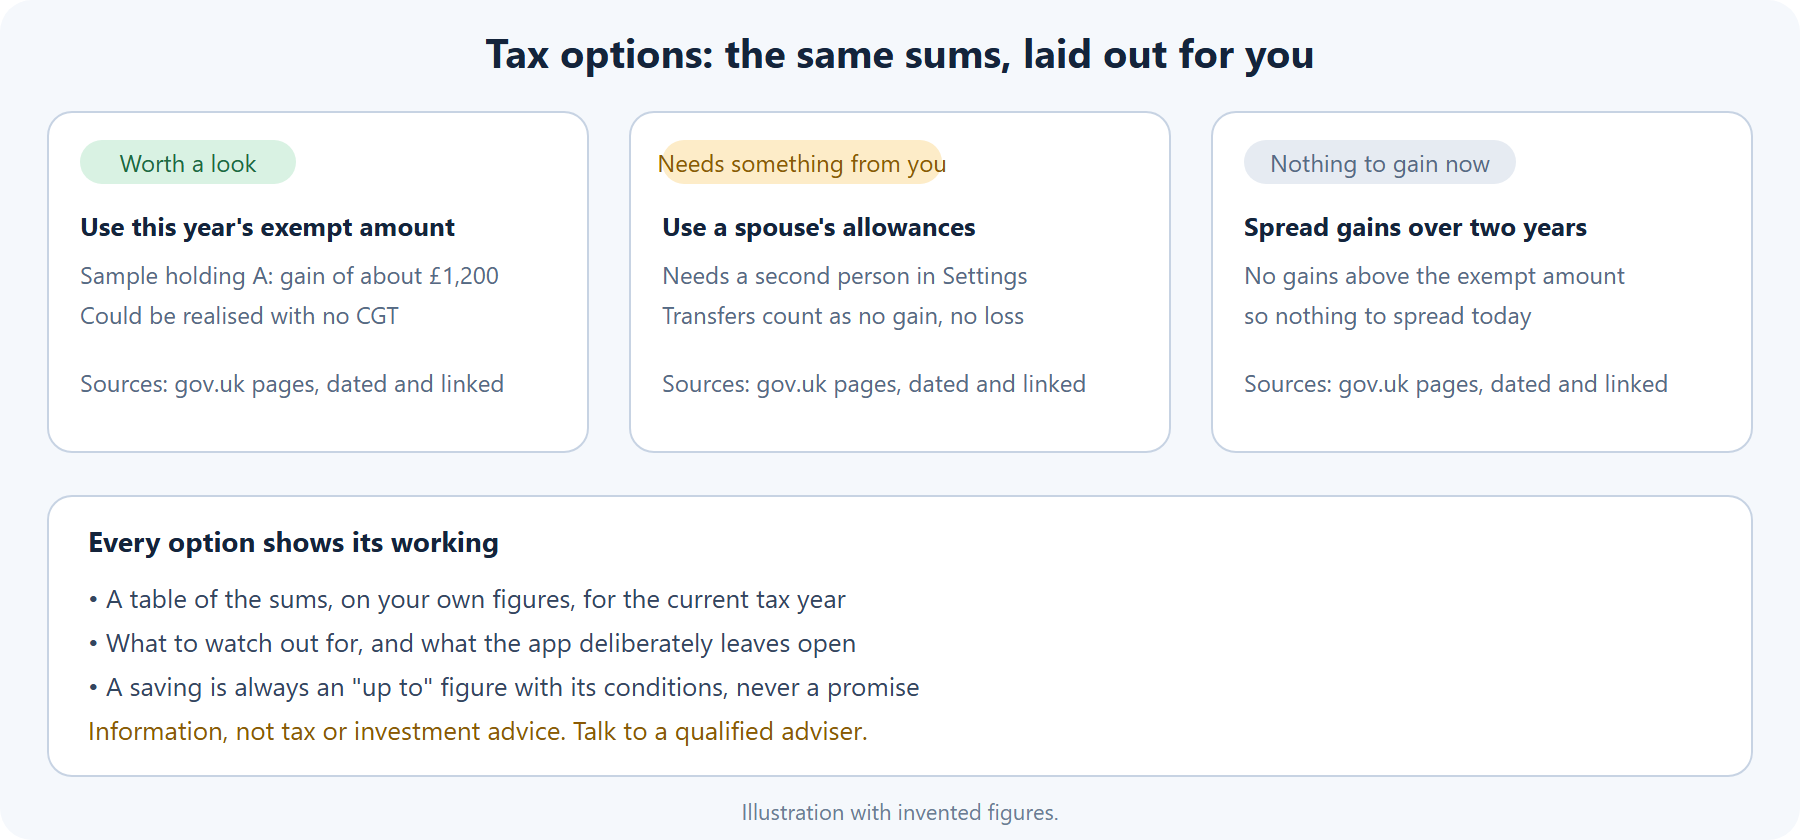
The newest tab lists the ways HMRC’s published rules allow tax to be reduced, worked out on the user’s own figures: using the yearly exempt amount, moving holdings into an ISA (“Bed and ISA”), using a spouse’s allowances, harvesting losses, spreading gains over two tax years, and pension or Gift Aid contributions that widen the basic-rate band. Each option names the official pages it rests on, with a link, the date they were read and what was taken from each. A test refuses to build any option that cites no source, or one that is not on the approved list.
Where the official guidance doesn’t settle a question, such as whether buying shares back inside an ISA counts under the 30-day rule, the app says it is unsettled rather than quietly picking an answer.
How it’s built
The stack is deliberately plain: Electron for the shell, React for the interface, ECharts for charts, SQLite for storage, decimal.js for money, and zod for validating everything that crosses a boundary. It is TypeScript throughout.
The split that matters
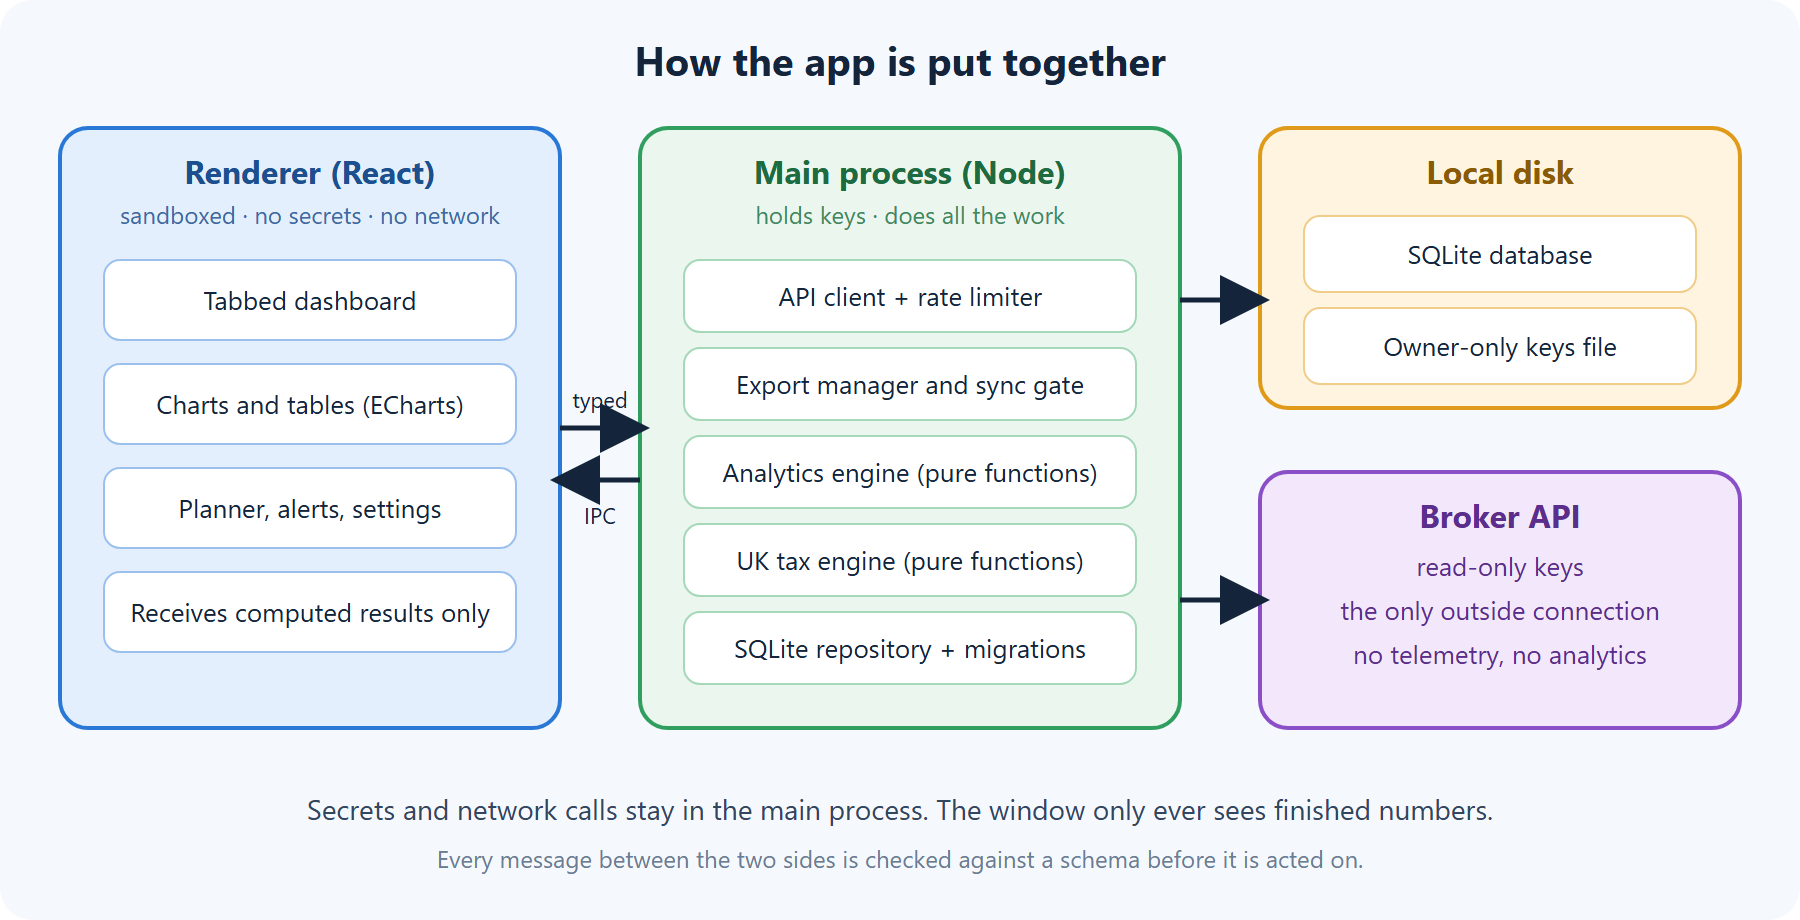
Everything sensitive and everything that touches the network lives in the main process. The window is sandboxed, runs with context isolation and no Node access, and only receives finished results. Every message from the window is checked against a schema before it is acted on, so even a compromised page could ask for very little.
Pure functions for the maths
Analytics and tax are functions with no side effects, so each can be tested against known answers. The project has several hundred automated tests, including cross-checks where the same figure is computed two independent ways and the results must agree, plus invariants such as “the parts of the gain must add up to the total.”
Money is not a floating-point number
All amounts go through a decimal library. It costs nothing at the start and saves a whole category of “off by a penny” bugs later.
Being polite to an API
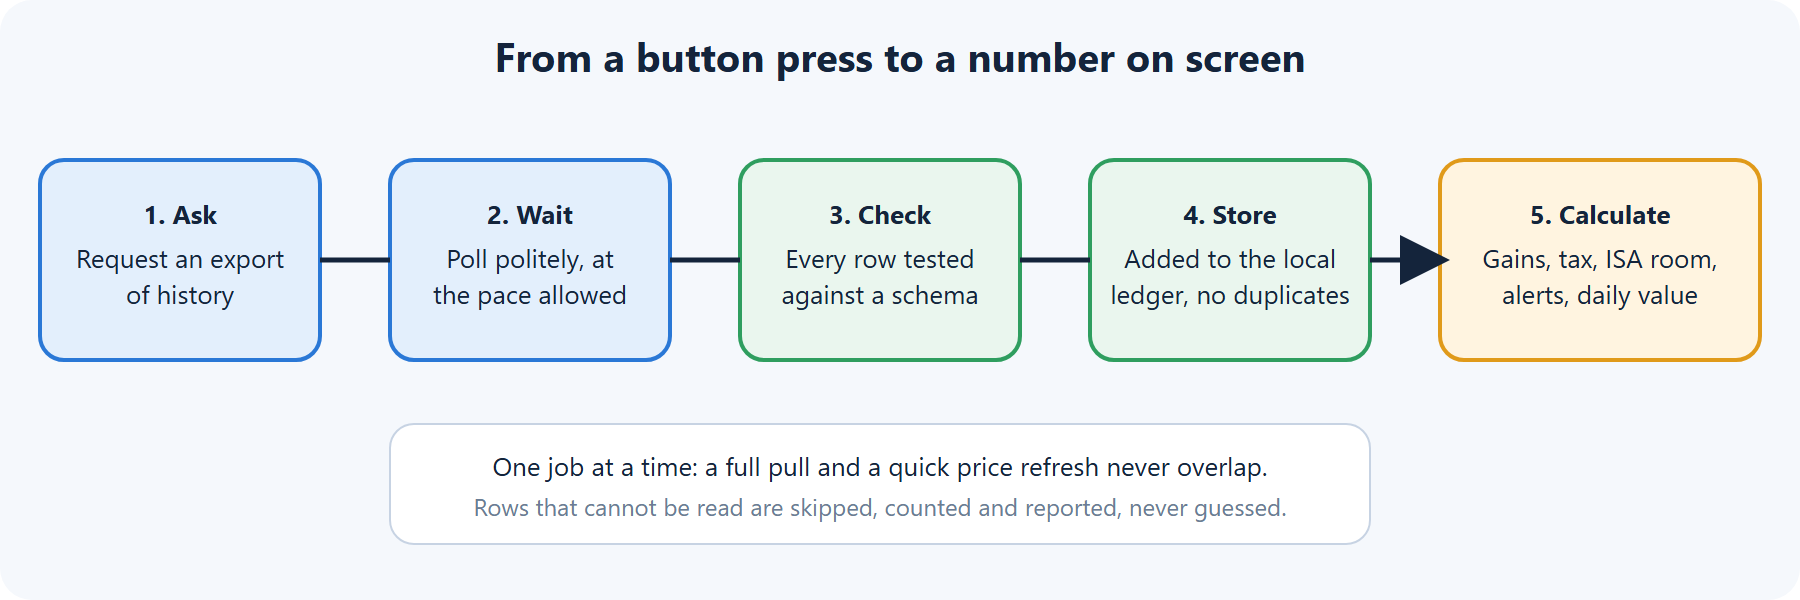
The broker’s API limits how quickly you can ask for things, and the history export is a request, wait and download process. The client paces each kind of request separately, honours the server’s retry hints and runs one job at a time, so a full pull and a quick price refresh never collide.
Security and privacy
I treated this like anything that holds a complete financial history, because it does.
- Read-only keys, created without trading scopes, so the app physically cannot trade.
- Keys never touch the database, the logs or the window. They sit in an owner-only file outside any synced folder, and backups never include them.
- One outside connection, to the broker, and nothing else.
- A hardened window: sandbox on, Node access off, navigation and pop-ups restricted to what’s expected.
Backups you can believe in
Some things can never be rebuilt from the broker: the daily value history, and anything typed in by hand. So backup and restore got more care than almost any other feature. A backup is made with SQLite’s own backup command, so it is consistent even mid-pull, and the app then reopens the new file, runs an integrity check and confirms the structure before keeping it. A restore refuses if a pull is running, validates the file, shows what it contains next to what’s there now, takes a safety copy of the current data and only then swaps the databases in a single step. If anything fails, the old data stays.
What I’d tell anyone building something similar
- Write the rules down first. A long plan with exact definitions of every headline number paid for itself many times. “Total gain” sounds obvious until four tabs each total something slightly different.
- Give each number one home. A recent tidy-up merged duplicate cards and folded small pages together, and added a note explaining why the tabs’ totals legitimately differ.
- Test against independent calculations. If two routes to the same figure disagree, you have found a bug before a tax return does.
- Be candid in the interface. “As of the last pull”, “estimate, not advice” and “not settled by the guidance” build more trust than false precision.
- Audit your own work. Periodic full reviews turned up fixes in places I’d have sworn were fine, such as how safety copies are named before a database upgrade.
Limits, and what’s next
It is a personal tool with real limits. It supports one broker. Some background features rely on macOS (a scheduled task, and phone alerts through the Shortcuts app), so Windows currently gets the dashboard but not those extras. It does not cover EIS or VCT schemes, trusts, inheritance tax or non-UK residents. Likely next steps include tighter Windows packaging, a content security policy on the window, and stronger protection for how keys are stored.
Not advice. This article describes a piece of software. Nothing here is tax, legal or investment advice, and the figures in the images are invented. Check any tax decision with a qualified adviser.
Related articles
 Software & AI
We Built a Studio That Writes, Paints, Voices and Animates Children’s Stories on a Single Home PC
How one local tool grew from "make me a nice intro video" into a story factory with a twenty-strong cast of talking characters, a self-healing painting queue and a rhythm game, all running on a graphics card with just 4 GB of memory.
 Software & AI
YouFibre Monitor
Is my broadband dropping out, or is it my imagination? A small monitor that checks a YouFibre connection every ten seconds and records exactly when the internet goes down - free for anyone to use.
 Software & AI
Gnome: Building a Programming System Inspired by Genetics, Development and Evolution
What would software look like if it could grow and evolve? Gnome is a programming system inspired by genetics, development and evolution.